Aggregating Logs
Application logs can help you understand what is happening inside your application. Likewise, container engines are designed to support logging. The kubectl log command is useful when you want to quickly have a look at why a pod has failed. However the native functionality provided by a container engine or runtime is usually not enough for a complete logging solution. For example, when you have several nodes hundreds of pods running on our cluster ,there should be a more efficient way to handle logs. That's why we need ELK.
ECK Stack
ELK is the acronym for three open source projects: Elasticsearch, Logstash, and Kibana. ELK support log management and analytics solution to monitor infrastructure as well as process any server logs and application logs.
E = Elasticsearch is an open-source, RESTful, distributed search and analytics engine built on Apache Lucene. Support for various languages, high performance, and schema-free JSON documents makes Elasticsearch an ideal choice for various log analytics and search use cases.
K = Kibana is an open-source data visualization and exploration tool for reviewing logs and events. Kibana offers easy-to-use, interactive charts, pre-built aggregations and filters, and geospatial support and making it the preferred choice for visualizing data stored in Elasticsearch.
L = Logstash is an open-source data ingestion tool that allows you to collect data from a variety of sources, transform it, and send it to your desired destination. With pre-built filters and support for over 200 plugins, Logstash allows users to easily ingest data regardless of the data source or type.
Logstash is a plugin-based data collection and processing engine. It comes with a wide range of plugins that makes it possible to easily configure it to collect, process and forward data in many different architectures. more info..
ELK Stack + Beat
One of the outstanding issues with Logstash is performance it consumes significant amount of memory especially when multiple pipelines and advanced filtering are involved.
Beats are open source data shippers that you install as agents on your servers to send operational data to Elasticsearch. Beats are deployed on Kubernetes as a Daemonset .It ensures that a specific pod is always running on all the cluster nodes. This pod runs the agent image and is responsible for sending the logs from the node to the central server. By default, Kubernetes redirects all the container logs to a unified location. The daemonset pod collects logs from this location.
Beat family include following beats.
|
Beat
|
Description
|
|
Filebeat
|
FileBeat is a lightweight shipper for forwarding
and centralizing log data. Installed as an agent on the servers. FileBeat
monitors the log files or locations that specify, collects log events, and
forwards them either to Elasticsearch or Logstash for indexing.
|
|
MetricBeat
|
Metricbeat is a lightweight shipper running as a
Deamset. Metricbeat takes the metrics and statistics that it collects and
ships them to the Elasticsearch or Logstash for indexing. For example
following metrics we can used Kube-State-Metrics,
Apache
,HAProxy ,MongoDB ,MySQL Nginx ,PostgreSQL
,Redis ,System, Zookeeper etc.
|
|
HeatBeat
|
Heartbeat is a lightweight daemon that you install on a
remote server to periodically check the status of your services and determine
whether they are available.
|
|
PacketBeat
|
Packetbeat is a real-time network packet analyzer and also
we can analysis network traffic.
|
|
FunctionBeat
|
FunctionBeat is an Elastic Beat that you deploy as a
function in your serverless environment to collect data from cloud services
and ship it to the Elastic Stack.
|
|
Winlogbeat
|
Winlogbeat ships Windows event logs to Elasticsearch or
Logstas.
|
Deployment Architecture
In this article, we will use Red Hat® OpenShift® version 4.6. cluster. OpenShift is an enterprise-ready Kubernetes container platform with full-stack automated operations to manage hybrid cloud and multi-cloud deployments. This is how components are run on the openshift cluster, Beats are run on every worker node and other components are runs according to given replicas. In here we are using simple .Net Core application for testing.
Beats are run on every worker node as a DemonSet collect logs and send to the Logstash. Logstash on the fly process the logs ,filter the logs and send it to the Elasticsearch to store and for the indexing. Kibana we can use view the logs.Set Up ELK Cluster
Prerequisites
To run the following instructions, you must first:
- Be a system:admin user or a user with the privileges to create Projects, CRDs, and RBAC resources at the cluster level.
- Set virtual memory settings on the Kubernetes nodes (as described in Step 1 below).
1. Increase your virtual memory
Elasticsearch uses a mmapfs directory by default to efficiently store its indices. The default operating system limits on mmap counts is likely to be too low, which may result in out of memory exceptions.
echo 'vm.max_map_count=262144' >> /etc/sysctl.conf
2. Create new project
Create an elastic OpenShift project:
oc new-project elastic
3. Install the ECK operator
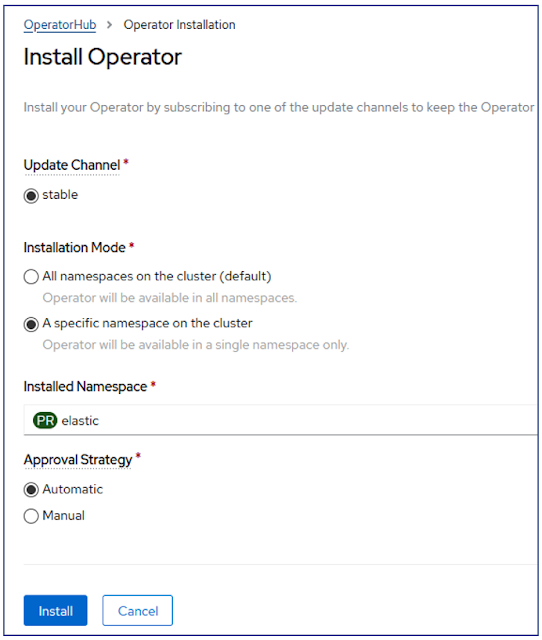
Install the ECK operator using openshift Operator Hub. Navigate to the OperatorHub search ECK
Install with the default setting to the "elastic" namespace.
4. Deploy Elasticsearch
Navigate to the Elasticsearch Cluster tab in ECK Operator. Click create button and select yaml view mode and replace the yaml file. download the ymal file from the git-repository.
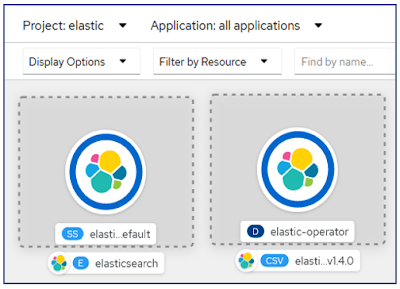
After install the Elasticsearch navigate to the openshift developer mode topology.5. Create Route For Elasticsearch
Create route for Elasticsearch to expose to the outside.
Navigate to the Route tab in Openshift and Create Route.
Provide the any name "elasticsearch-route" , select service on the dropdown menu "elasticsearch-es-http" and Target Port 9200.
Select Secure route then select TLS Termination Passthrough and Insecure Traffic Redirect.
Click on the route url and enter the username "elastic". To get the password navigate Secrets ,select "elasticsearch-es-elastic-user" copy the password.
After login to the elasticsearch.
This username and password we need to login using kibana.
6. Deploy Kibana
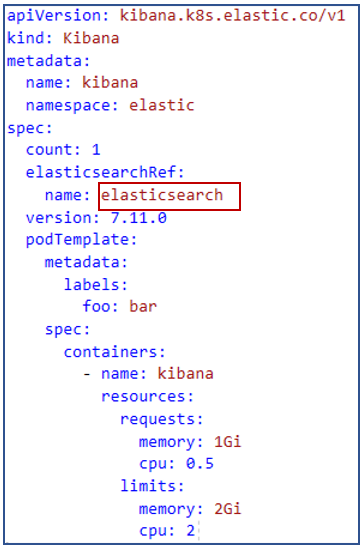
Navigate to the kibana tab in ECK Operator. Click create button and select yaml view mode and replace the yaml file. Download the kibana ymal file from the git-repository.
Aslo need to replace the elasticsearchRef with the Elasticsearch name.
Create a route for the kibana same as elasticsearch.
Once Install Elasticsearch and Kibana , You can check both component are working as expected using oc command. First login to the openshift cluster using GitBash or any other tool and login to the openshift cluster.
oc peoject <project-name>
oc get elastic
7. Login To Kibana
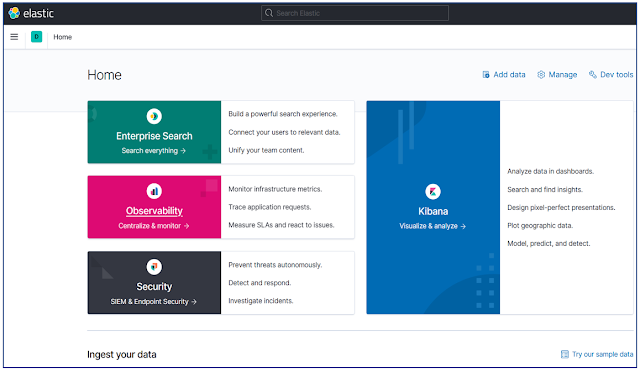
Login to the Kibana using username "elastic". To get the password navigate Secrets ,select "elasticsearch-es-elastic-user" copy the password.
After login to the Kibana we can see the Kibana dashboard.
8. Installing Logstash
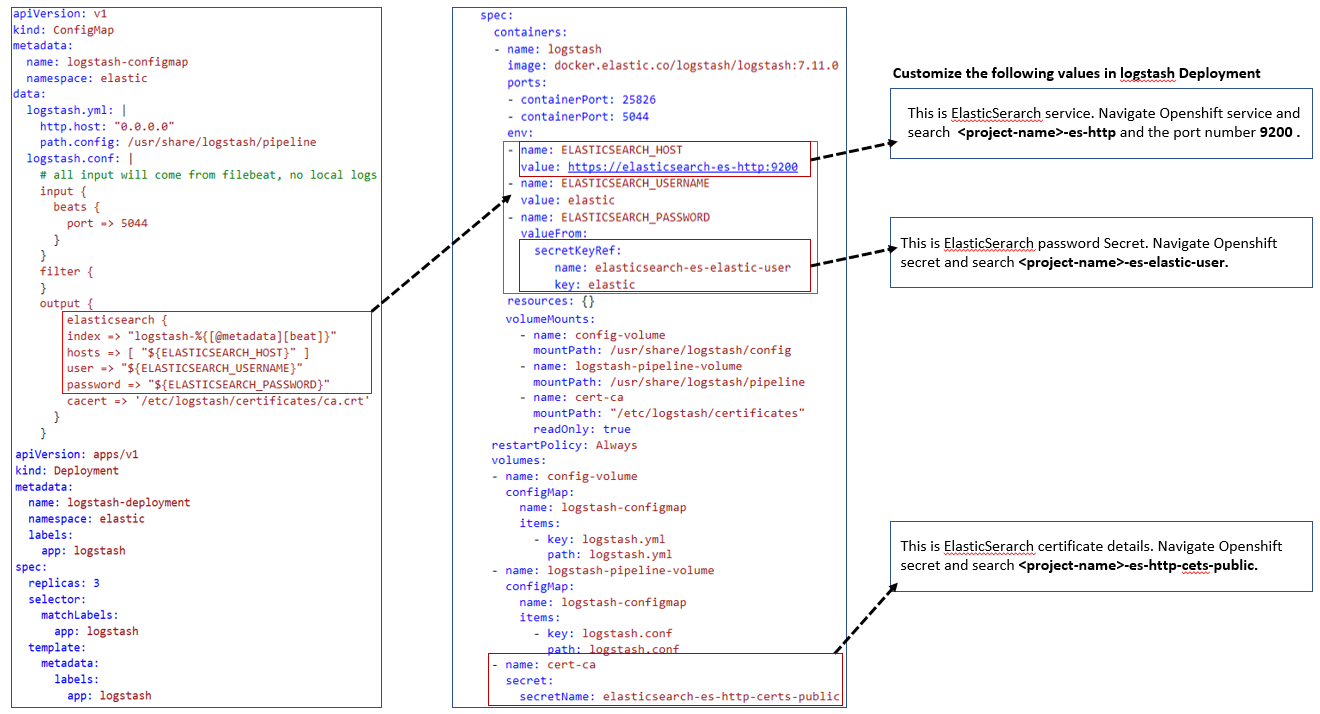
Logstash acts as an adapter that receives the raw logs, and formats it in a way that Elasticsearch understands. The tricky part about Logstash lies in its configuration. The rest is just a deployment that mounts the configuration file as a ConfigMap and a Service that exposes Logstash to other cluster pods.
The configMap contains two files: logstash.yml and logstash.conf.
Logstash.yml file it defines the network address on which Logstash will listen, we specified 0.0.0.0 to denote that it needs to listen on all available interfaces and also we specified where Logstash should find its configuration file which is /usr/share/logstash/pipeline.
The logstash.conf file is what instructs Logstash about how to parse the incoming log files. index =>logstash-%{[@metadata][beat]}
base on the filebeat or metricbeat it will create Index inside Elasticsearch.
Login to the cluster using Git Bash or any other tool .
oc login -u <userName> then enter the openshift password to login.
oc project <project-name> navigate to the openshift project.
Create a new file called logstash.yml ( vi logstash.yaml) and copy the yaml content and execute the following command.
oc create -f logstash.yaml
The last resource we need here is the Service that will make this pod reachable. Create a new file called logstash-service.yml and add the following lines.execute the logstash-service.yml following command.
oc create -f logstash-service.yaml
After install the Logstash ,Elasticsearch and Kibana will show on the Openshift Topology.









Great Blog!!! thanks for sharing with us.
ReplyDeletecareer in software testing
software testing career