Monitor Kubernetes Logs, Metrics, and Metadata with ELK and Beats Part -3
Installing MetricBeat Agent
Metricbeat helps you monitor your servers and the services they host by collecting metrics from the operating system and services.

You deploy Metricbeat as a DaemonSet to ensure that there’s a running instance on each node of the cluster. These instances are used to retrieve most metrics from the host, such as system metrics, Docker stats, and metrics from all the services running on top of Kubernetes.
Kube-state-metrics
kube-state-metrics is a simple service that listens to the Kubernetes API server and generates metrics about the state of the objects. It is not focused on the health of the individual Kubernetes components, but rather on the health of the various objects inside, such as deployments, nodes and pods.
Download the yaml file from my git repository.
Run the following command to execute "kube-state-metrics".
oc create -f kube-state-metrics.yaml


Monitor OpenShift with Elastic Observability
Now that we have Filebeat shipping OpenShift logs to Elasticsearch, we can open up Kibana and start monitoring system health from Elastic Observability.
1. Create Index Patten
Login to kibana using elastic username and password. Then Navigate to the Stack Management under Kibana section select Index Patterns.
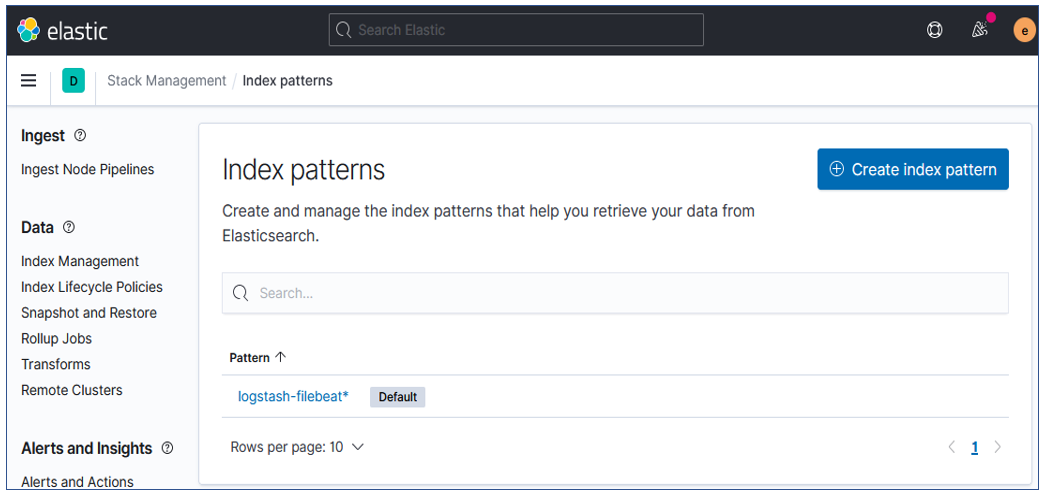
If we able to successfully deployed Filebeat and Logstash, it should show index as shown below. Type the Index pattern name same as index and click Next step.

After Create it will show the lists of every field in the logstash-filebeat* index and the field's associated core type as recorded by Elasticsearch.


2. Discover Logs
Then Navigate to the Analytics then Discover.
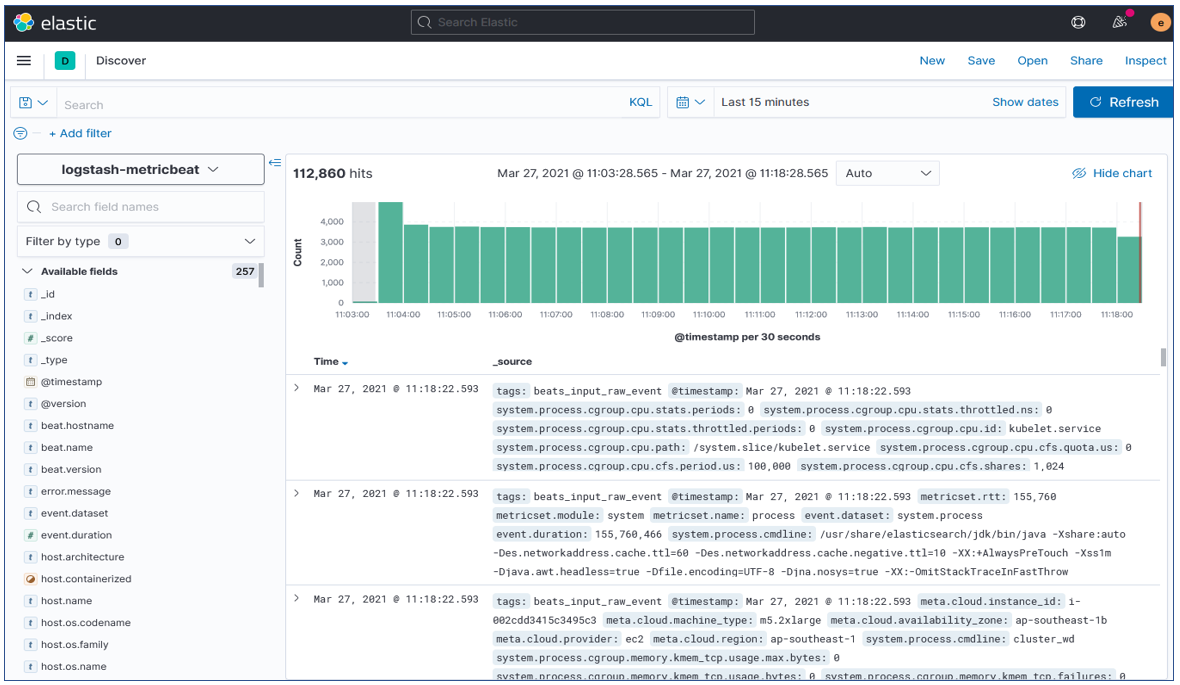
Add Filter for Kubernetes module to extracts the logs .

Add a filter for the event.

for example , "kubernetes.event.metadata.name" , "kubernetes.event.metadata.namespace" ,"kubernetes.even.message" etc.

You can save the Queries by click the save button on left top.

Deploy any kind of sample application to your project using S2i or any other option. In here I am using source to image option to deploy the application. This is a .Net core sample application ,you can see the source code from my git repository (link).
After successfully deployed your application, navigate to the elastic search and set the time "20 secounds" and Refresh the logs. Once there is no logs ,try to scale up the application pod once scale up at the same time Refresh the logs.
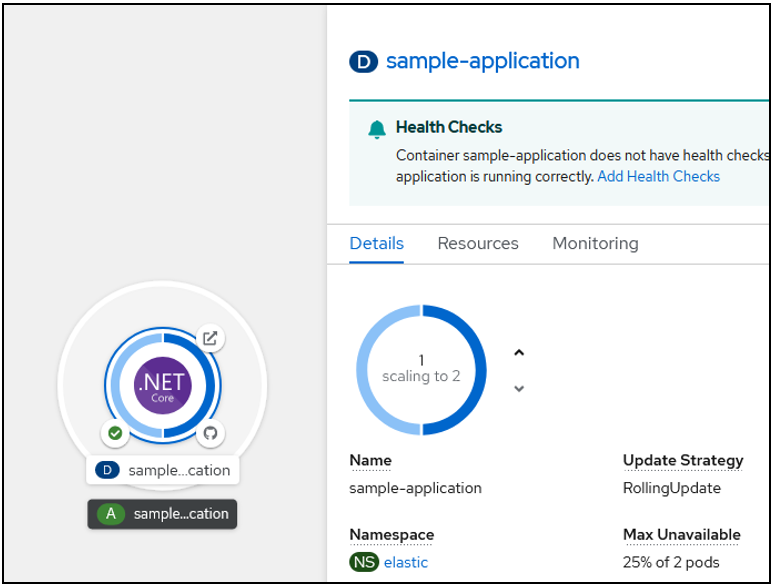
You can see how the pods are assign on the Kubernetes.

Same way scale down the application pods.

Delete the Elasticserarch Index.
Navigate to the Stack Management => Index Management and delete the indices.

Enjoy!!! stay safe.


Comments
Post a Comment