Monitor Kubernetes Logs, Metrics, and Metadata with ELK and Beats Part -2
Installing Filebeat Agent
Filebeat is the agent that we are going to use to ship logs to Logstash.

The configMap that holds the Filebeat configuration, we specify output.logstash:hosts: '${LOGSTASH_URL}' that it needs to ship the log data to Logstash. We’re specifying the Service short URL since both resources live in the same namespace.

We are using a DaemonSet for this deployment. A DaemonSet ensures that an instance of the Pod is running each node in the cluster.

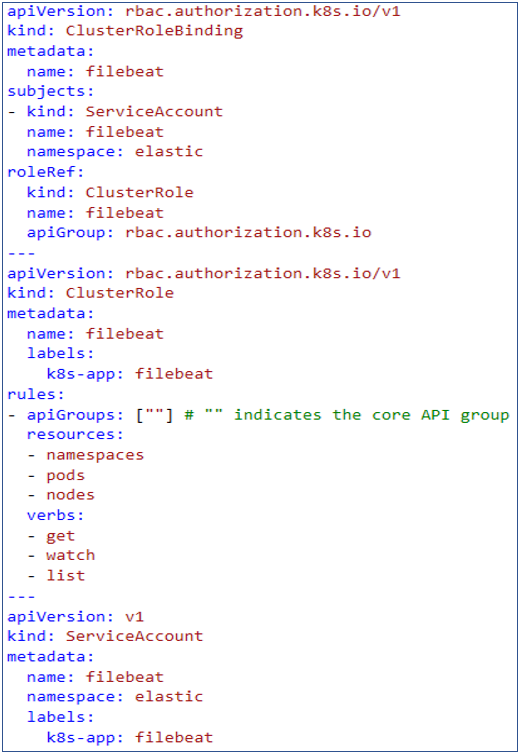
To deploy Filebeat, we need to create a service account, a cluster role, and a cluster role binding.
After install the FileBeat , Logstash ,Elasticsearch and Kibana will show on the Openshift Topology.

Monitor OpenShift with Elastic Observability
Now that we have Filebeat shipping OpenShift logs to Elasticsearch, we can open up Kibana and start monitoring system health from Elastic Observability.
1. Create Index Patten
Login to kibana using elastic username and password. Then Navigate to the Stack Management under Kibana section select Index Patterns.

If we able to successfully deployed Filebeat and Logstash, it should show index as shown below. Type the Index pattern name same as index and click Next step.

Select the time field dropdown @timestamp and click the Create index pattern button ,shown as below.


2. Discover Logs
Then Navigate to the Analytics then Discover.


Comments
Post a Comment